


In 2020, Google introduced unified guidance for great user experience (UX) on the web called Core Web Vitals. It’s proposed to evaluate specific metrics and have numerical estimates for such a multifaceted discipline. Current metrics focus on loading, interactivity, and visual stability. You might think, “Nice stuff, thank you, Google. I’ll save this to my bookmarks and look into it once the time comes for nice-to-have investigations!” But before deciding, have a closer look into the following. This year, Google implemented the metrics of Core Web Vitals in the Search Engine ranking algorithm as one of the factors. To be precise, the rollout of page experience in ranking systems began in mid-June of 2021 and completed at the end of August.
Does that mean that we should notice a completely different ranking of Google Search results in September already? Or the horror case, our websites to be shown in the s-e-c-o-n-d Search Engine Results Page (SERP)? Drastic changes won’t appear overnight, but the update will undoubtedly influence the future of ranking. First of all, the usability of web pages is only one factor that influences ranking. Meaning of inserted query, the relevance of a page, quality of sources, context, and settings are other “big influencers” deciding the final results. Secondly, most websites are in the same boat getting “not great, not terrible” grades. According to Google Core Web Vitals Study April 2021, only four percent of all studied websites are prepared for the update and have a good ranking in all three metrics. It’s good timing for companies to invest efforts for necessary improvements and easily stand out among other websites. Lastly, user expectations continue to rise higher standards, and Google has a responsibility to help users reach relevant searches. At the same time, Google pushes the digital community to prioritize UX because that helps to keep users on their websites. Google's study shows that visitors are 24% less likely to abandon the websites that meet proposed metrics thresholds.
Your brains are most likely filled with dopamine by thinking about possible UX improvements to your website. Let’s use that momentum and dig deeper into each metric of Core Web Vitals.
Core Web Vitals Metrics
Core Web Vitals is the subset of unified guidance for great UX indication called Web Vitals. Core metrics highlight the metrics that matter most. Metrics are not written in stone! They represent the best available indicators developers have today. Thus, be welcoming for future improvements or additions.
The current set of metrics is largest contentful paint (LCP), first input delay (FID), and cumulative layout shift (CLS).

Largest Contentful Paint
LCP measures the time to render the largest element in a currently viewed page part. The purpose is to measure how quickly the main content is ready to be used for the user. Discussions and research helped to understand that the main content is considered the largest element as an image or text block in a viewport. Exposed elements are
- <img>
- <image> inside an <svg> (Note: <svg> itself currently is not considered as a candidate)
- <video>
- an element with a background image loaded via the url()
- block-level elements containing text nodes or other inline-level text elements children.
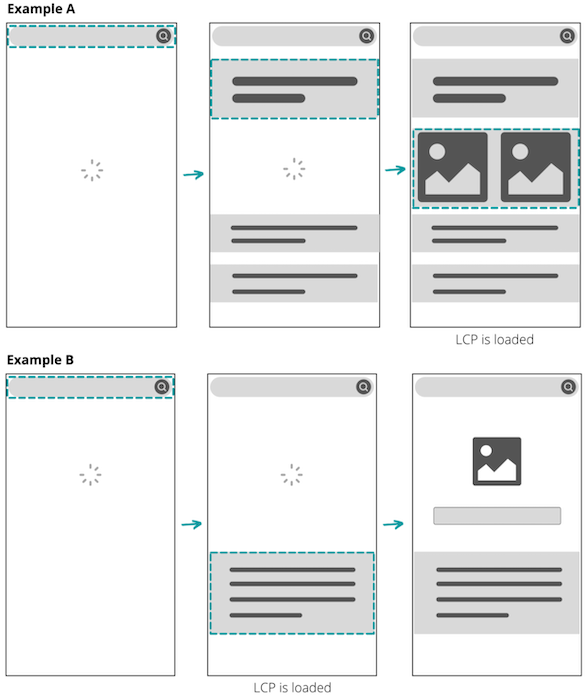
During the page load, the largest element in a viewport is detected as a candidate of LCP. It might change until the page is fully loaded. In example A below, the candidate changed three times since larger elements were found. Commonly, the LCP is the last loaded element, but that’s not always the case. In example B below, the paragraph of text is the largest element displayed before a page loads an image. Comparing the two, example B has a better LCP score than example A.
Websites should meet 2.5 seconds or less LCP for getting a score that indicates good UX. But… Why 2.5? The inspiration was taken from studies by Stuart K. Card and Robert B. Miller, that found that a user will wait roughly 0.3 to 3 seconds before losing focus. In addition, gathered data about top-performing sites across the Web showed that such a limit is consistently achievable for well-optimized sites.
| Good | Poor | |
| LCP | <= 2.5s | > 4s |
| FID | <= 100ms | > 300ms |
| CLS | <= 0.1 | > 0.25 |
The thresholds of “good” and “poor” Web Core Vitals scores. The scores in between are considered “needs improvement”.
First Input Delay
FID quantifies the user’s first impression of the responsiveness and interactivity of a page. To be precise, how long does a browser take to become available to respond to the first user’s interaction on a page. For instance, the time between when the user clicks on the “open modal” button and when the browser is ready to trigger the modal opening. You may wonder, shouldn’t the code be executed immediately after the user’s action? Not necessarily, during page load, the browser’s main thread is super busy parsing and executing loaded JavaScript (JS) files—incoming events might wait until processing.

FID measures only the delay in event processing. Time to process the event and update UI afterwards were deliberately excluded to avoid workarounds like moving event processing logic to asynchronous callbacks. The workaround would improve such metric scores because it separates processing from the task associated with the event. Sadly, that wouldn’t bring any benefits for the user—likely the opposite.
User’s interactions require the main thread to be idle even when the event listener is not registered. For example, the main thread might delay the user’s interaction with the following HTML elements until it completes ongoing tasks:
- text fields, checkboxes, and radio buttons (<input>, <textarea>)
- select dropdowns (<select>)
- links (<a>).
Jakob Nielsen described in the Usability Engineering book: “0.1 second is about the limit for having the user feel that the system is reacting instantaneously, meaning that no special feedback is necessary except to display the result”. Despite being first described in 1993, the same limit is considered good in Core Web Vitals nowadays.
Cumulative Layout Shift
CLS measures visual stability and counts how much the visible content shifts around. Layout shifts occur when existing elements change their start position defined by Layout Instability API. Note that when a new element is added to the DOM or an existing element changes size—it doesn’t count as a layout shift!
The metric is named “cumulative” because the score of each shift is summed. In June 2021, the duration of CLS was improved for long-lived pages (for example SPAs and infinite scroll apps) by grouping layout shifts and ensuring the score doesn’t grow unbounded.
Are all layout shifts bad? No. CLS focuses only on unexpected ones. Expected layout shifts occur within 500 milliseconds after user’s interactions (that is clicking on a link, typing in a search box, etc.). Such shifts are excluded from CLS score calculations. This knowledge may encourage creating extra space immediately after the user’s input with a loading state for tasks that take longer to complete.
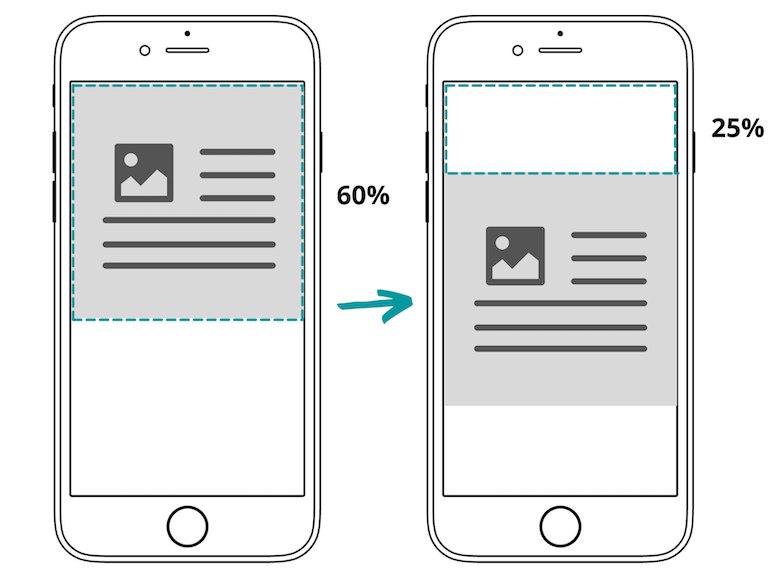
Let’s use a tiny bit of math to calculate the layout shift score of the following example:
- Impact fraction describes the amount of space an unstable element takes up of a viewport. When an element covers 60% of a viewport, its impact fraction is 0.6.
- Distance fraction defines the amount of space that an unstable element moves from the original to the final position. When an element moves by 25% of a viewport height, its distance fraction is 0.25.
- Having layout_shift_score = impact_fraction * distance_fraction formula, the layout shift score of this example is 0.6 * 0.25 = 0.15.
A good CLS score is considered to be 0.1 or less for a page. Evaluated real-world pages revealed that the shifts of such good scores are still detectable but not excessively disruptive. Leaving shifts of 0.15 score and above consistently the opposite.
How to Measure the Score of My Web Page?
There are many different toolings to measure Core Web Vitals for a page. Tools reflect two main measurement techniques: in the lab or in the field.
In the Lab
Lab data, also known as synthetic data, is collected from a simulated environment without a user. Measures in such an environment can be tested before features are released in production. Be aware that FID can’t be measured in such a way! Lab data doesn’t contain the required real user input. As an alternative, it’s suggested to track its proxy—Total Blocking Time (TBT).
Tooling:
- Lighthouse: I think it is the most comprehensive tool using lab data. It can be executed either on public or authenticated web pages. The generated report indicates the scores and suggests personalised opportunities to improve the performance. The best part is that Chrome users already have this tool ready to be used under DevTools. The drawback I noticed during using the tool—the screen of a page should be visible during the measurement process. Thus, the same browser doesn’t support the analysis of several pages in parallel. Lastly, Lighthouse can be incorporated into continuous integration workflows via Lighthouse CI.
- WebPageTest: The tool can perform analyses for public pages. I was tricked by the tool when I provided a URL of the authenticated page for the first time. I got results. Better than I expected. Just before patting myself on the back, I decided to dig deeper into a waterfall view. The view showed clearly that the authenticated page wasn’t even reached and it was navigated to a public login page. Despite that, the tool has handy options to test against different locations, browsers, and device emulators. It might help to identify which country or state troubles the most and start thinking about Content Delivery Network (CDN). Finally, be aware that the report includes detailed analyses but doesn’t provide advice for improvements.
- Web Vitals extension: It's the most concrete tool of all. It contains only metrics and scores for the currently viewed page. In addition, the tool shows how it calculates scores in real-time. For example, FID is shown as “disabled” until your interaction happens on a page.
In the Field
A site’s performance can vary dramatically based on a user’s personalized content, device capabilities, and network conditions. Real User Monitoring (RUM) captures the reality of page performance, including the mentioned differences. Monitoring data shows the performance experienced by a site’s actual users. On the other hand, there’s a way to check the real-world performance of a site without a RUM setup. Chrome User Experience Report gathers and aggregates UX metrics across the public web from opted-in users. Such findings power the following tools:
- Chrome UX Report Compare Tool (CRUX): As the name dictates, the tool is meant for pages’ comparison. The report includes metrics and scores of selected devices’ groups: desktop, tablet, or mobile. It is a great option to compare your site with similar pages of your competitors.
- PageSpeed Insights: The tool provides detailed analyzes for URLs that are known by Google’s web crawlers. In addition, it highlights the opportunities for improvements.
- Search Console: The tool reports performance data per page, including historical data. Before using it—verification of ownership is mandatory.
- Web Vitals extension: The tool was mentioned for lab toolings, but there’s one more feature to reveal. For pages in which field data is available via Chrome UX Report, lab data (named “local” in the extension) is combined with real-user data from the field. This integration might indicate how similar your individual experiences are to other website users.
CRUX based tools are great and quick starters for investigations. Despite that, your retrieved RUM data can provide more detailed and immediate feedback. To setup RUM for a website might look scary at the beginning, but usually, it takes these steps:
- In order to send data from a website, a developer implements a RUM Javascript snippet to the source code.
- Once the user interacts or leaves the website, the data about an experience is sent to a collector. This data is processed and stored in a database that anyone can view via convenient dashboards.
How to Improve
Core Web Vitals provides insights into what’s hurting the UX. For example, setting up RUM even for a few hours can reveal where the most significant pain points exist. The worst scoring metrics and pages can indicate where to start searching for improvements. Other toolings mentioned in the previous section might suggest how to fix the specific issues. The great thing is that all scores will likely increase by applying changes to improve one metric.
Many indications and bits of advice may sound like coins in the Super Mario game, which are hanging for you to grab. That isn’t the case. The hard and sweaty work remains on your table! Not all opportunities are straightforward to implement. Some might include big and long-lasting refactoring that can’t be done in one go or for which preparations should be completed. Thus, it adds several strategies to start explorations:
-
Update third-party libraries. After reviewing your application libraries, you might reveal that some are no longer used or lighter alternatives (covering the same use case) exist. Next, sometimes only a part of the included library is actually used. That leads to the situation where a portion of JS code is loaded without purpose at all. Tree-shaking could solve this issue. It enables loading only registered specific features from a library instead of loading everything. Be aware that not all libraries support tree-shaking yet, but it’s getting more and more popular. Updates of application dependencies may sound like a small help, but let’s lead by an example. During Shopify internal Hack Days, my team executed the mentioned updates for our dropshipping app Oberlo. It decreased the compressed bundle size of the application by 23%! How long did it take for research and development? Less than three days.
This improves FID and LCP. -
Preload critical assets. The loading process might be extended due to the late discovery of crucial page resources by the browser. By noting which resources can be fetched as soon as possible, the loading can be improved drastically. For example, Shopify noticed a 50% (1.2 seconds) improvement in time-to-text-paint by preloading Web Fonts.
This improves FID and LCP. -
Review your server response time. If you’re experiencing severe delays, you may try the following:
a) use a dedicated server instead of a shared one for web hosting
b) route the user to a nearby CDN
c) cache static assets
d) use service workers to reduce the amount of data users need to request from a server.
This improves FID and LCP -
Optimize heavy elements. Firstly, shorten the loading and rendering of critical resources by implementing the lazy-loading strategy. It defers the loading of large elements like images below the page viewport once it’s required for a user. Do not add lazy loading for elements in the initial viewport because the LCP element should be loaded as fast as possible! Secondly, compress images to have fewer bytes to download. Images don’t always require high quality or resolution and can be downgraded intentionally without affecting the user. Lastly, provide dimensions as width and height attributes or aspect-ratio boxes. It ensures that a browser can allocate the correct amount of space in the document while the image is loading to avoid unexpected layout shifts.
This improves FID, LCP, and CLS.
To sum everything up, Google introduced Core Web Vitals to help us to improve the UX of websites. In this article, I’ve shared clarifications of each core metric, the motives of score thresholds, tools to measure the UX scores of your web pages, and strategies for improvements. Loading, interactivity, and visual stability are the metrics highlighted today. Future research and analyses might reveal different Core Web Vitals to focus on. Be prepared!
Meet the author of this article—Laura Silvanavičiūtė. Laura is a Web Developer who is making drop-shipping better for everyone together with the Oberlo app team. Laura loves Web technologies and is thrilled to share the most exciting parts with others via tech talks at conferences or articles on medium.com/@laurasilvanavi.
Wherever you are, your next journey starts here! If building systems from the ground up to solve real-world problems interests you, our Engineering blog has stories about other challenges we have encountered. Intrigued? Visit our Engineering career page to find out about our open positions and learn about Digital by Default.