


One of the most compelling ways to prove the value of any decision or intervention—to technical and non-technical audiences alike—is to run an A/B test. But what if that wasn’t an option on your current stack? That’s the challenge we faced at Shopify. Our amazing team of engineers built robust capabilities for experimentation on our web properties and Shopify admin experiences, but testing external channels like email was unexplored. When it came time to ship a new recommendation algorithm that generates personalized blog post suggestions, we had no way to measure its incremental benefit against the generic blog emails.
To address the problem I built an email experimentation pipeline from the ground up. This quick build helps the Marketing Data Science team solve challenges around experimentation for external channels, and it’s in use by various data teams across Shopify. Below is a guide that teaches you how to implement a similar pipeline with a relatively simple setup from scratch.
The Problem
Experimentation is one of the most valuable tools for data teams, providing a systematic proof of concept mechanism for interface tweaks, product variations, and changes to the user experience. With our existing experimentation framework Verdict, we can randomize shops, as well as sessions for web properties that exist before the login gate. However, this didn’t extend to email experiments since the randomization isn’t triggered by a site visit and the intervention is in the user’s inbox, not our platform.
As a result, data scientists randomized emails themselves, shipped the experiment, and stored the results in a local text file. This was problematic for a number of reasons:
- Local storage isn’t discoverable and can be lost or deleted.
- The ad hoc randomization didn’t account for users that unsubscribed from our mailing list and didn’t resolve the many-to-many relationship of emails to shops, creating the risk for cross-contamination between the variations. Some shops have multiple staff each with an email address, and some people create multiple shops under the same email address.
- Two marketers can simultaneously test the same audience with no exclusion criteria, violating the assumption that all other variables are controlled.
Toward the end of 2019, when email experimentation became even more popular among marketers as the marketing department grew at Shopify, it became clear that a solution was overdue and necessary.
Before You Start
There are few things I find more mortifying than shipping code just to ship more code to fix your old code, and I’m no stranger to this. My pull requests (PRs) were rigorously reviewed, but myself and the reviewers were in uncharted territory. Exhibit A: a selection of my failed attempts at building a pipeline through trial and error:

Github PR montage, showing a series of bug fixes
All that to say that requirements gathering isn’t fun, but it’s necessary. Here are some steps I’d recommend before you start.
1. Understanding the Problem
The basic goal is to create a pipeline that can pull a group constrained by eligibility criteria, randomly assign each person to one of many variations, and disseminate the randomized groups to the necessary endpoints to execute the experiment. The ideal output is repeatable and usable across many data teams.
We define the problem as: given a list of visitors, we want to randomize so that each person is limited to one experiment at a time, and the experiment subjects can be fairly split among data scientists who want to test on a portion of the visitor pool. At this point, we won’t outline the how, we’re just trying to understand the what.
2. Draw a System Diagram
Get the lay of the land with a high-level map of how your solution will interact with its environment. It’s important to be abstract to prevent prescribing a solution; the goal is to understand the inputs and outputs of the system. This is what mine looked like:
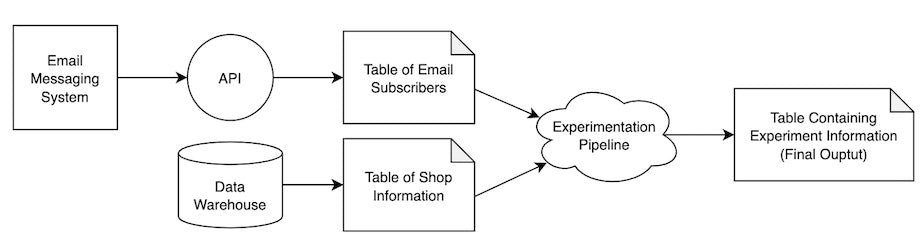
Example of a system diagram for email experiment pipeline
In our case, the data come from two sources: our data warehouse and our email platform.
In a much simpler setup—say, with no ETL at all—you can replace the inputs in this diagram with locally-stored CSVs and the experiment pipeline can be a Jupyter notebook. Whatever your stack may be, this diagram is a great starting point.
3. Plan the Ideal Output
I anticipated the implementation portion to be complicated, so I started by whiteboarding my ideal production table and reverse-engineered the necessary steps. Some of the immediate decisions that arose as part of this exercise were:
- Choosing the grain of the table: subjects will get randomized at the shop grain, but the experience of the experiment variation is surfaced with the primary email associated with that shop.
- Considering necessary resolvers: each experiment is measured on its own success metric, meaning the experiment output table needs to be joined to other tables in our database.
- Compatibility with existing analysis framework: I didn’t want to reinvent the wheel; we already have an amazing experiment dashboard system, which can be leveraged if my output is designed with that in mind.
I built a table with one row per email, per shop, per experiment, and with some additional attributes detailing the timing and theme of the experiment. Once I had a rough idea of this ideal output, I created a mock version of an experiment with some dummy data in a CSV file that I uploaded as a temporary table in our data warehouse. With this, I brainstormed some common use cases and experiment KPIs and attempted to query my fake table. This allowed me to identify pitfalls of my first iteration; for example, I realized that in my first draft that my keys wouldn’t be compatible with the email engagement data we get from the email platform API, which is the platform that sends our emails.
I sat with some stakeholders that included my teammates, members of the experimentation team, and non-technical members of the marketing organization. I did a guided exercise where I asked them to query my temporary table and question whether the structure can support the analysis required for their last few email experiments. In these conversations, we nailed down several requirements:
- Exclude subjects from other experiments: all subjects in a current experiment should be excluded from other experiments for a minimum of 30 days, but the tool should support an override for longer exclusion periods for testing high risk variations, such as product pricing.
- Identify missing experiment category tags: the version of the output table I had was missing the experiment category tags (ex. research, promotional, etc) which is helpful for experiment discoverability.
- Exclude linked shops: if an email was linked to multiple shops that qualified for the same experiment, all shops linked to that email should be excluded altogether.
- Enable on-going randomization of experiments: the new pipeline should allow experiments to randomize on an ongoing basis, assigning new users as they qualify over time (as opposed to a one-time batch randomization).
- Backfill past experiments into the pipeline: all past email experiments needed to be backfilled into the pipeline, and if a data scientist inadvertently bypassed this new tool, the pipeline needs to support a way to backfill these experiments as well.
After a few iterations and with stakeholders’ blessing, I was ready to move to technical planning.
4. Technical Planning
At Shopify, all major projects are drafted in a technical document that’s peer-reviewed by a panel of data scientists and relevant stakeholders. My document included the ideal output and system requirements I’d gathered in the planning phase, as well as expected use cases and sample queries. I also had to draw a blueprint for how I planned to structure the implementation in our ETL platform. After chatting with my lead and discussions on Slack, I decided to build the pipeline in three stages, demonstrated by the diagram below.
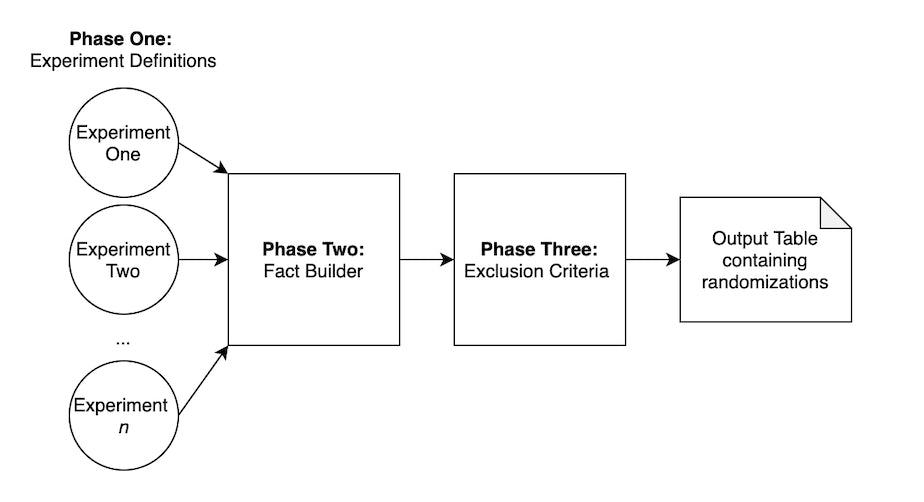
Proposed high-level ETL structure for the randomization pipeline
Data scientists may need to ship experiments simultaneously; therefore for the first phase, I needed to create an experiment definition file that defines the criteria for candidates in the form of a SQL query. For example, you may want to limit a promotional offer to shops that have been on the platform for at least a year, and only in a particular region. This also allows you to tag your experiment with the necessary categories and specify a maximum sample size, if applicable. All experiment definition files are validated on an output contract as they need to be in agreement to be unioned in the next phase.
Phase two contains a many-to-one transform stage that consolidates all incoming experiments into a single output. If an experiment produces randomizations over time, it continues to append new rows incrementally.
In phase three, the table is filtered down in many ways. First, users that have been chosen for multiple experiments are only included in the first experiment to avoid cross-contamination of controlled variables. Additionally, users with multiple shops within the same experiment are excluded altogether. This is done by deduping a list at the email grain with a lookup at the shop grain. Finally, the job adds features such as date of randomization and indicators for whether the experiment included a promotional offer.
With this blueprint in hand, I scheduled a technical design review session and pitched my game plan to a panel of my peers. They challenged potential pitfalls, provided engineering feedback, and ultimately approved the decision to move into build.
5. Building the Pipeline
Given the detailed planning, the build phase follows as the incremental implementation of the steps described above. I built the jobs in PySpark and shipped in increments, small enough increments to be consumable by code reviewers since all of the PRs totalled several thousand lines of code.
6. Ship, Ship, Ship!
Once all PRs were shipped into production, the tool was ready to use. I documented its use in our internal data handbook and shared it with the experimentation team. Over the next few weeks, we successfully shipped several email experiments using the pipeline, which allowed me to work out small kinks in the implementation as well.
The biggest mistake I made in the shipping process is that I didn’t share the tool enough across the data organization. I found that many data scientists didn’t know the tool existed, and continued to use local files as their workaround solution. Well, better late than never, I did a more thorough job of sending team-wide emails, posting in relevant Slack channels, and setting up GitHub alerts to notify me when other contributors edit experiment files.
As a result, the tool has not only been used by the Marketing Data Science, but across the data organization by teams that focus on shipping, retail and international growth, to ship email experiments for the past year. The table produced by this pipeline integrated seamlessly with our existing analysis framework, so no additional work was required to see statistical results once an experiment is defined.
Key Takeaways
To quickly summarize, the most important takeaways are:
- Don’t skip out on requirement gathering! Understand the problem you’re trying to solve, create a high-level map of how your solution will interact with its environment, and plan your ideal output before you start.
- Draft your project blueprint in a technical document and get it peer-reviewed before you build.
- When building the pipeline, keep PRs smaller where possible, so that reviewers can focus on detailed design recommendations and so production failures are easier to debug.
- Once shipped, make sure you share effectively across your organization.
Overall, this project was a great lesson that a simple solution, built with care for engineering design, can quickly solve for the long-term. In the absence of a pre-existing A/B testing framework, this type of project is a quick and resourceful way to unlock experimentation for any data science team with very few requirements from the data stack.
Are you passionate about experiments and eager to learn more, we’re always hiring! Reach out to us or apply on our careers page.