"Is there a way to extract Datadog metrics in Python for in-depth analysis?"
This question has been coming up a lot at Shopify recently, so I thought detailing a step-by-step guide might be useful for anyone going down this same rabbit hole.
Follow along below to learn how to extract data from Datadog and build your analysis locally in Jupyter Notebooks.
Why Extract Data from Datadog?
As a quick refresher, Datadog
So, why would you ever need Datadog metrics to be extracted?
There are two main reasons why someone may prefer to extract the data locally rather than using Datadog:
- Limitation of analysis: Datadog has a limited set of visualizations that can be built and it doesn't have the tooling to perform more complex analysis (e.g. building statistical models).
- Granularity of data: Datadog dashboards have a fixed width for the visualizations, which means that checking metrics across a larger time frame will make the metric data less granular. For example, the below image shows a Datadog dashboard capturing a 15 minute span of activity, which generates metrics on a 1 second interval:

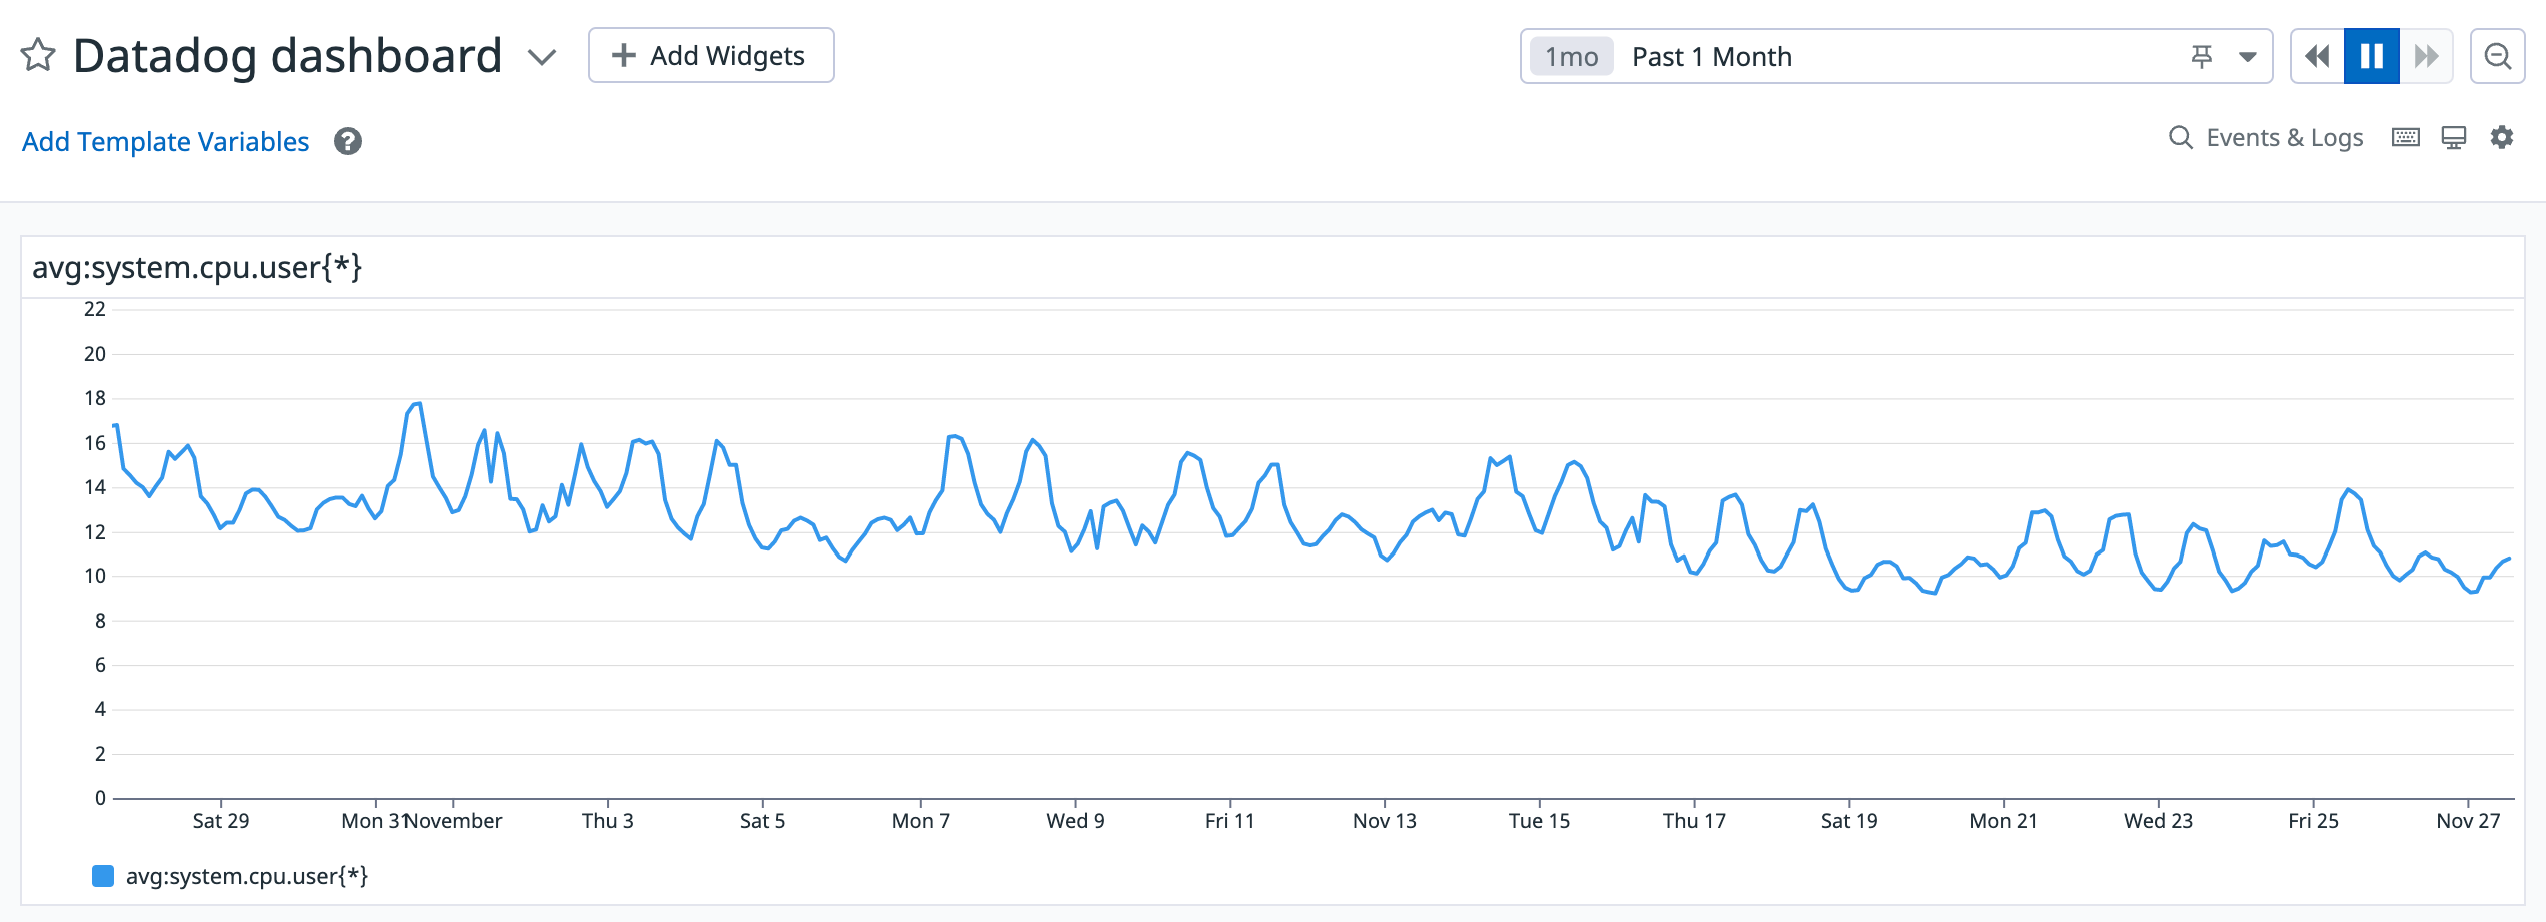
Comparatively, the below image shows a Datadog dashboard that captures a 30 day span of activity, which generates metrics on a 2 hour interval:

As you can see, Datadog visulaizes an aggregated trend in the 2 hour window, which means it smoothes (hides) any interesting events. For those reasons, someone may prefer to extract the data manually from Datadog to run their own analysis.
How to Extract Data and Build Your Own analysis
For the purposes of this blog, we’ll be running our analysis in Jupyter notebooks. However, feel free to use your own preferred tool for working with Python.
Datadog has a REST API which we’ll use to extract data from.
In order to extract data from Datadog's API, all you need are two things :
- API credentials: You’ll need credentials (an API key and an APP key) to interact with the datadog API.
- Metric query: You need a query to execute in Datadog. For the purposes of this blog, let’s say we wanted to track the CPU utilization over time.
Once you have the above two requirements sorted, you’re ready to dive into the data.
Step 1: Initiate the required libraries and set up your credentials for making the API calls:
Step 2: Specify the parameters for time-series data extraction. Below we’re setting the time period from Tuesday, November 22, 2022 at 16:11:49 GMT to Friday, November 25, 2022 at 16:11:49 GMT:
One thing to keep in mind is that Datadog has a rate limit of API requests. In case you face rate issues, try increasing the “time_delta” in the query above to reduce the number of requests you make to the Datadog API.
Step 3: Run the extraction logic. Take the start and the stop timestamp and split them into buckets of width = time_delta.

Next, make calls to the Datadog API for the above bucketed time windows in a for loop. For each call, append the data you extracted for bucketed time frames to a list.
Lastly, convert the lists to a dataframe and return it:
Step 4: Voila, you have the data! Looking at the below mock data table, this data will have more granularity compared to what is shown in Datadog.

Now, we can use this to visualize data using any tool we want. For example, let’s use seaborn to look at the distribution of the system’s CPU utilization using KDE plots:
As you can see below, this visualization provides a deeper insight.

And there you have it. A super simple way to extract data from Datadog for exploration in Jupyter notebooks.
Kunal is a data scientist on the Shopify ProdEng data science team, working out of Niagara Falls, Canada. His team helps make Shopify’s platform performant, resilient and secure. In his spare time, Kunal enjoys reading about tech stacks, working on IoT devices and spending time with his family.
Are you passionate about solving data problems and eager to learn more about Shopify? Check out openings on our careers page.


